Hair Density Comparison
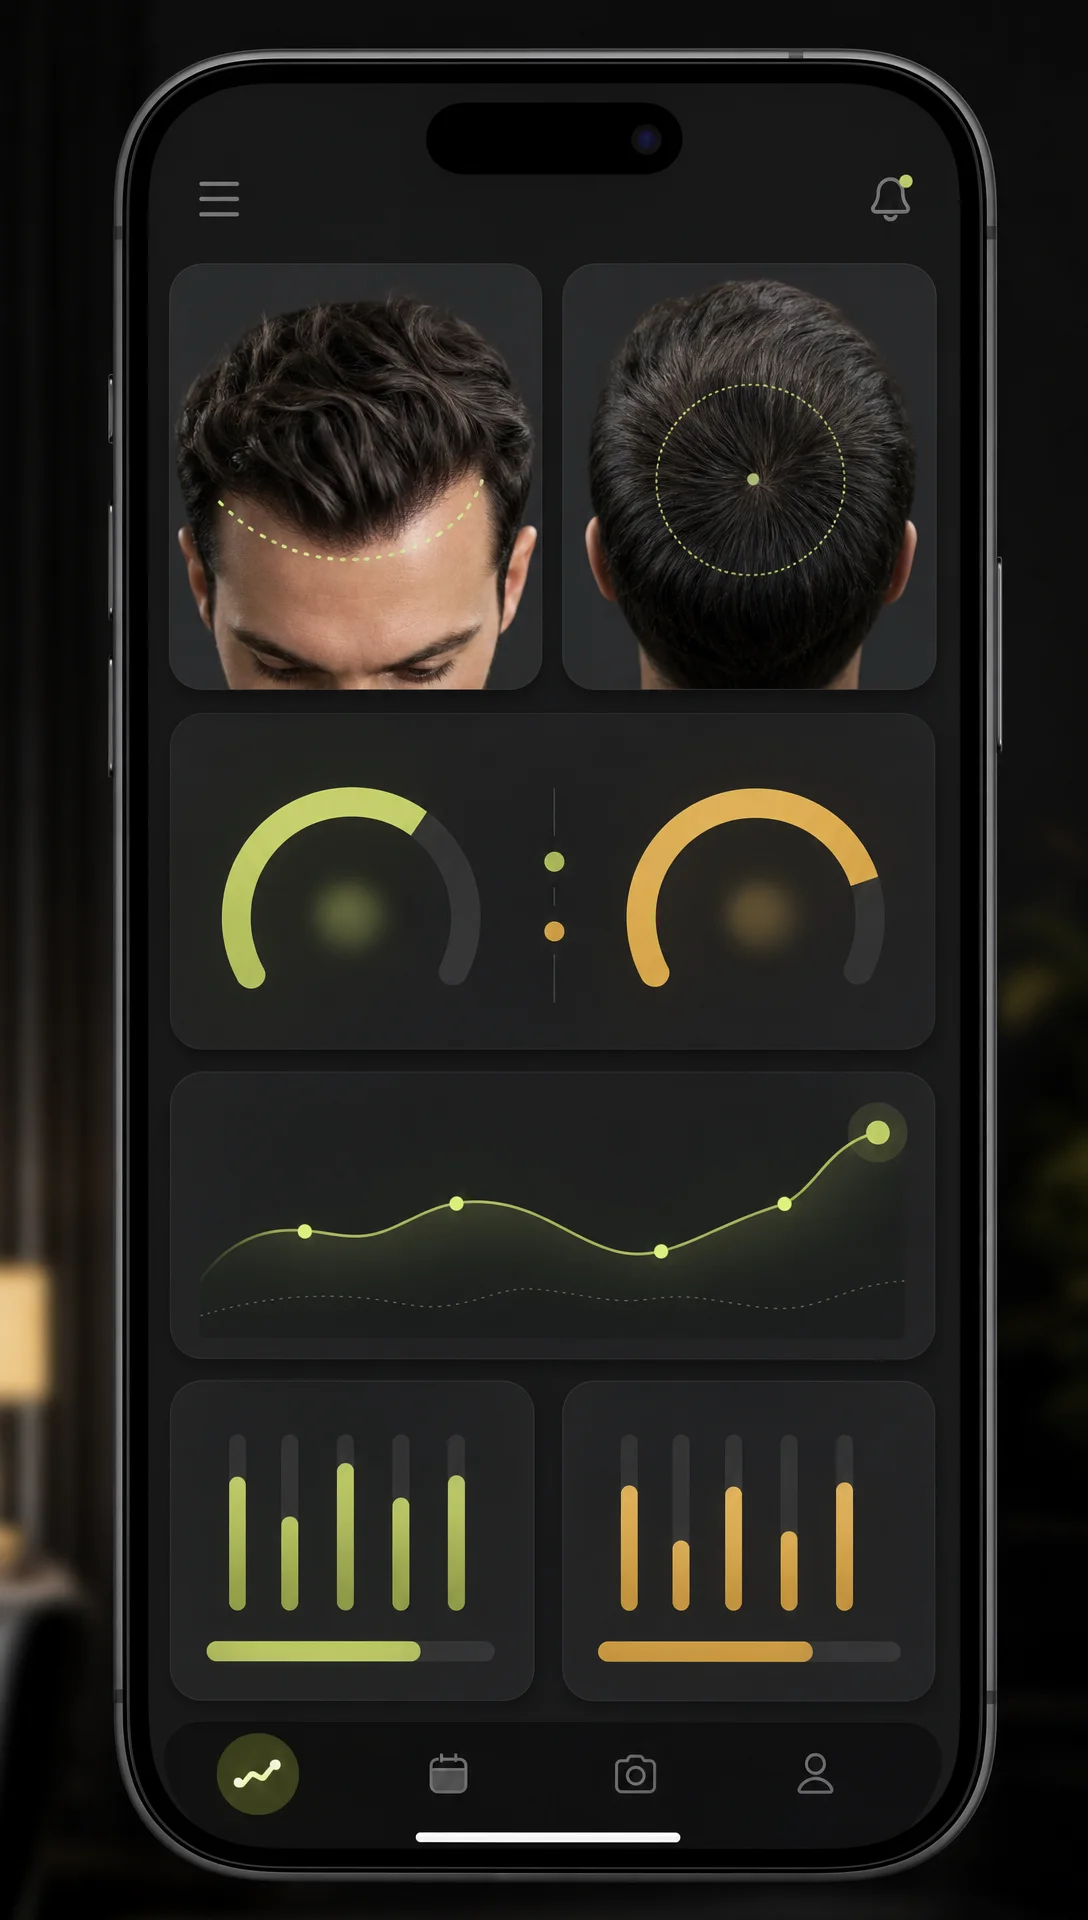
Everyone who worries about density eventually tries the camera-roll experiment: dig up an old photo, take a new one, hold them side by side and squint. It almost never settles anything — the old shot was a different angle in different light with a different haircut, and the comparison collapses into 'maybe?' A real before/after needs the before and after to match: same four angles, same framing, similar light, hair in a similar state. That's what a guided scan enforces. Each one records your part width, crown coverage, and overall density as stable tiers, dated and saved, so any two points in time can be compared like with like. The photos answer 'does it look different?' and the tiers answer 'did the read actually move?' — two answers that finally agree with each other.
Photos and a blurred preview are free. The full reading is $2.99 — your stage, whether it looks early, and what to do next.
How it works
Same four angles, every time — so each new scan compares fairly to your very first.
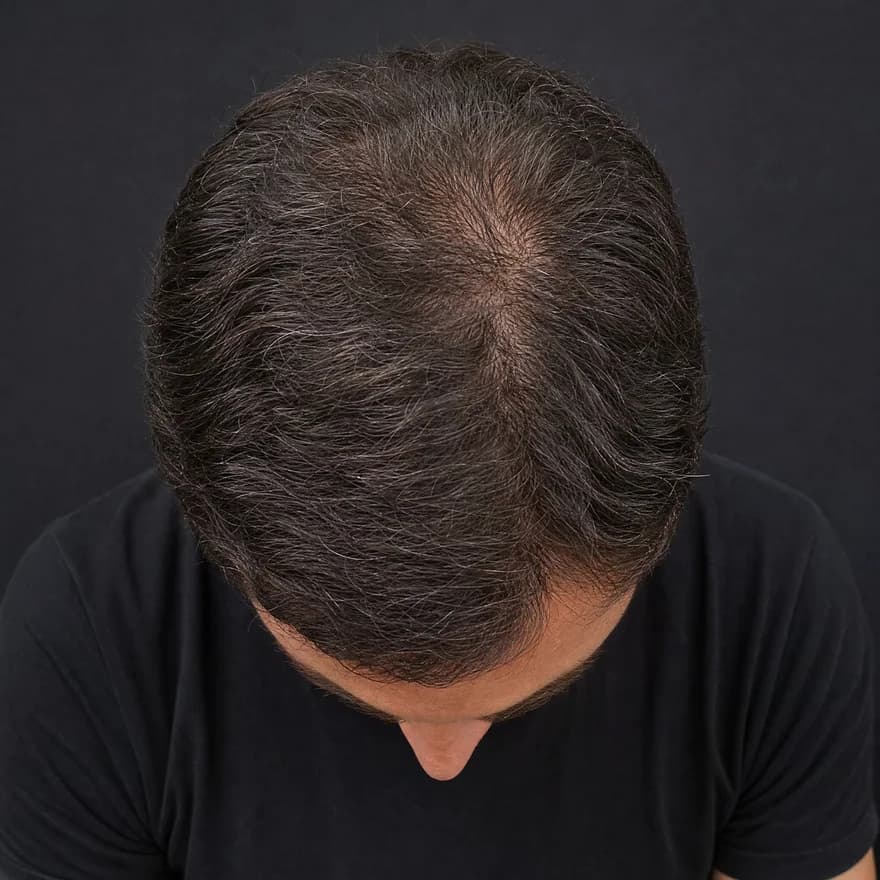
Top · Crown
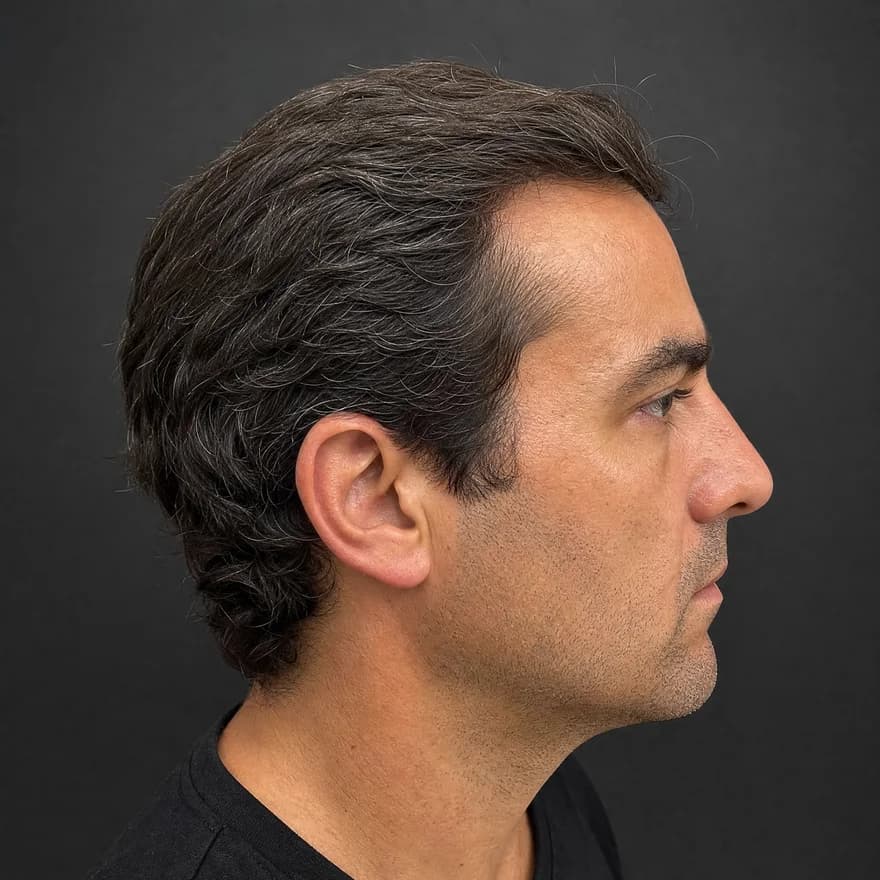
Side · Temple
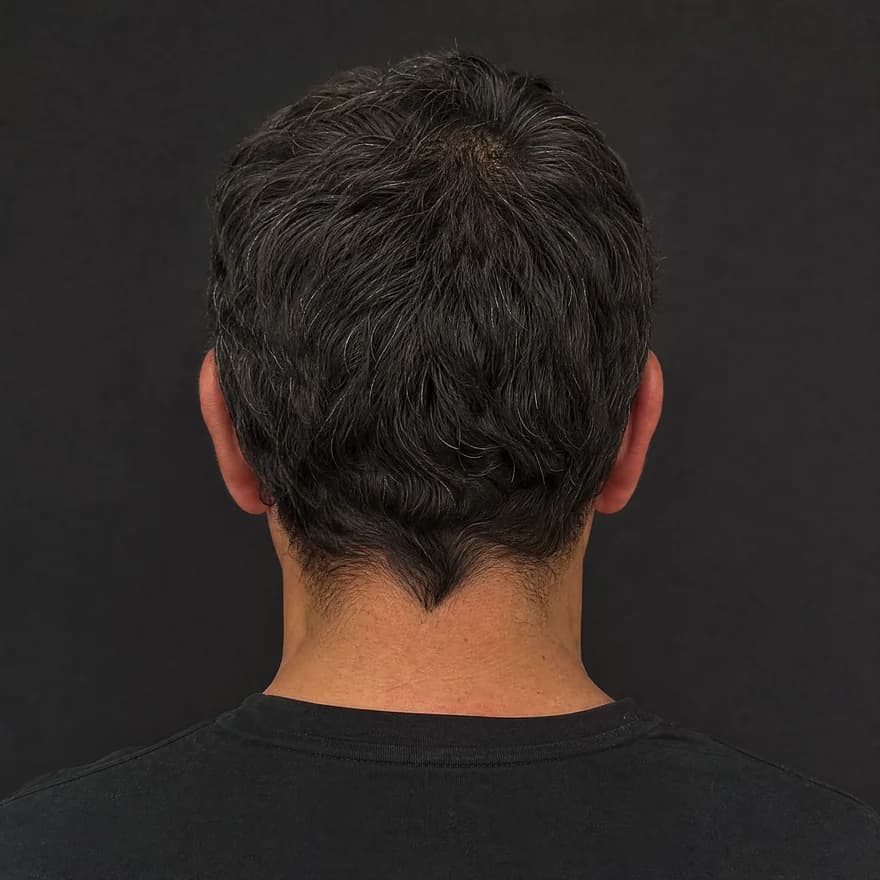
Back
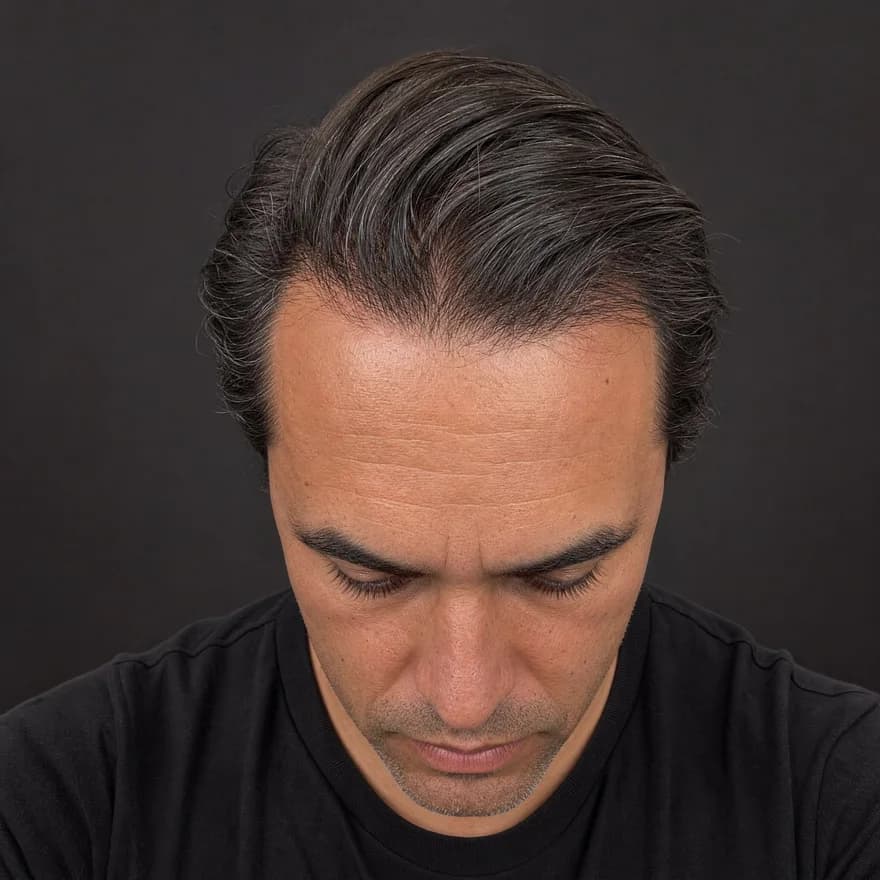
Front · Hairline
Same four angles, every time — illustrative example
Front · crown · temple · back
Four guided angles in about 30 seconds — the same views every time.
Hairline · density · scalp
AI reads each angle for hairline shape, crown density, and scalp surface.
Usable · limited · low-light
Every reading shows its confidence — limited views are flagged, not guessed.
Your baseline, revisited
Save it, rescan later, and see exactly what moved.
Why camera rolls fail
The difference isn't effort — it's control of variables. One method can settle the question, the other re-opens it.
Both approaches use photos. Only one produces comparisons your eyes can actually trust.
What gets compared
A before/after is only as good as what's measured on each side. Every scan records the same set.
How much scalp shows at the part line and crown — the zones where density change becomes visible first, read under the same framing every time.
The front silhouette and temple depth, read as a tier — so 'is the line moving?' rides along with every density comparison.
Stable graded reads instead of invented percentages. Tiers hold steady between scans of the same head — which is what makes month-to-month deltas meaningful.
Each read carries its confidence level. A comparison built on two low-confidence scans says so, instead of pretending certainty.
Build the comparison
Four guided angles, about thirty seconds, clean dry hair. This becomes your dated baseline — the fixed point every later scan is measured against.
Give it 8–12 weeks before the 'after.' Density moves slowly; comparisons inside a few weeks mostly measure styling, light, and mood.
The capture flow frames the same angles automatically, so the after matches the before — the property camera-roll comparisons never have.
Compare photos angle by angle and tiers side by side. Then keep going: a run of dated scans turns before/after into a trend line — the version worth showing a professional if it drifts.
What you get
An illustrative example of the density read — yours is built from your own four angles, scan after scan.
Questions
Hold everything constant except the date: the same angles (front, top, both sides, back), similar even lighting, and hair in a similar state — clean, dry, unstyled. Then compare the pairs angle by angle rather than jumping between random shots. A guided scan automates the constancy part, which is where DIY comparisons usually fall apart.
Photos show the visible side of density — how much scalp shows through at the part, the crown, and the hairline under even light. That's an appearance read, not a strand count, and it's exactly what changes when density genuinely moves. Read as tiers across identical angles, it's stable enough to compare honestly between months.
Two possibilities, and the comparison is doing its job either way. Visible density may genuinely be holding — 'feels thinner' often runs ahead of 'looks thinner,' especially in a stressful stretch. Or the change is real but below what casual photos resolve, which is why the scan reads tiers rather than trusting eyeballs. A stable tier across scans is a real, reassuring answer.
For density, 8–12 weeks between scans is the honest minimum — visible change is slow, and comparisons closer together mostly capture styling and lighting noise. The most telling comparisons run longer: baseline against six months, or the same month a year apart, which also cancels out any seasonal wobble.
A dated baseline plus disciplined rescans. Each scan reads density as tiers with a confidence level; the trend across scans — holding, stepping down, or recovering — is the actual answer. One comparison is a data point; three or four across a year is a direction you can act on, including bringing it to a professional if it drifts.
Taking the four guided photos and previewing your report is free, no sign-up. Each full analysis is $2.99 per scan, and every unlocked scan saves as a dated record. Side-by-side before/after comparisons, full scan history, and long-term trend views are part of Premium — $4.99/mo or $29.99/yr — built for people tracking across many months.
A note on transparency
ScalpAnalysis AI reads appearance-based signals and tracks visible change over time. It does not diagnose, treat, cure, or prevent any condition.
If you have pain, sudden shedding, or signs of infection, a qualified professional is the right next step.
The report it produces
This is the exact report format a scan unlocks — qualitative tiers, your visible features, and a confidence level on every reading. Saved as a baseline you compare against on every rescan.
Your Hair Profile
Temples just starting to open — crown still covered
Density
Medium
Type
Wavy
Texture
Medium
Shine
Medium
Risk of Recession
Low
Hair Loss
Mild
Illustrative example · sample data
Related guides
From the blog
Photos and a blurred preview are free. The full analysis is $2.99, or invite 3 friends for one free analysis.
